Why Lead Time Matters for Supply Orders and Inventory
- Qubit Technology
- 3 days ago
- 14 min read

Lead time determines when you must place supply orders and how much safety stock you must hold. Get it wrong and you are either tying up cash in excess inventory or scrambling to expedite orders at premium freight rates while customers wait.
The short version:
Lead time sets your reorder point. The longer your supplier takes to deliver, the earlier you must trigger a purchase order, and the more inventory you need on hand to cover demand during that window.
Lead-time variability drives safety stock harder than average lead time does. A supplier who sometimes delivers in 7 days and sometimes in 21 days forces you to plan for the worst case, not the average.
Start this week: pull your recent purchase orders for your top SKUs, calculate actual PO-to-receipt days, compare them to the lead times in your ERP, and flag SKUs with significant gaps.
Treat lead time as a controllable procurement lever, not a fixed supplier attribute. That shift in mindset is where most of the savings come from.
Table of Contents
What lead time actually means, and the types you need to track
Why lead time matters for inventory costs and customer satisfaction
How lead time drives reorder point and safety stock, with worked examples
Practical levers to shorten lead time or control variability
Lead time in medical supplies procurement: a practical example
Queenssurgical: reliable medical supply fulfillment for procurement teams
What lead time actually means, and the types you need to track
Lead time is the elapsed time from when a purchase order is issued to when goods are received and available for use. That is the definition that matters for procurement planning. It is not the same as cycle time, which measures how long a process step takes in isolation.
Accurate lead-time data helps you coordinate sourcing, production, and delivery. Without it, you are guessing at reorder points and padding safety stock to compensate.
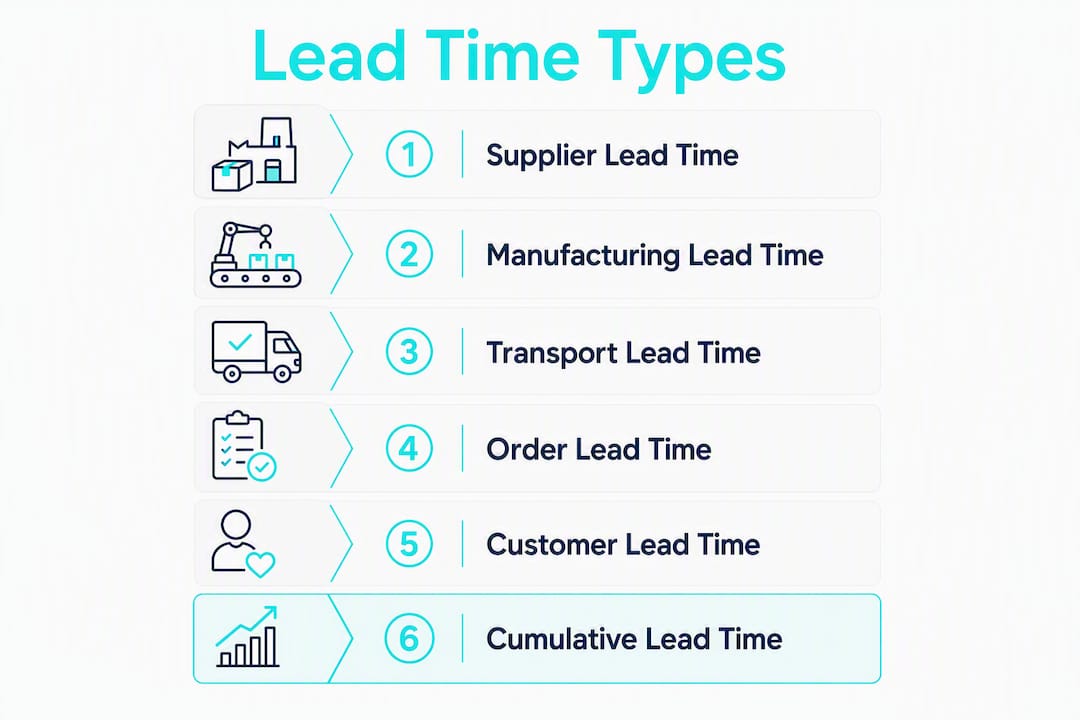
Most procurement teams track several distinct types:
Supplier lead time is the time from PO issuance to supplier shipment. This is the component most buyers negotiate and the one most often quoted in contracts.
Production or manufacturing lead time covers the time a supplier needs to make the goods, separate from transit. For custom or made-to-order items, this can dwarf transport time.
Transport or shipping lead time is the time goods spend in transit, including any customs clearance for imported medical supplies.
Order lead time is the full PO-to-receipt window, combining supplier processing, production, and transport. This is the number that goes into your ERP master data and drives your reorder calculations.
Customer lead time is the time from when a customer places an order with you to when they receive it. When your confirmed order lead time (COLT) exceeds the customer’s requested lead time (ROLT), that gap signals a service failure your customer is already feeling.
Cumulative lead time is the longest chain of dependent lead times from raw material to finished goods. In healthcare supply chains, this can stretch across multiple tiers of suppliers.
A quick process example: a hospital places a PO for isolation gowns. The supplier acknowledges in 2 days, produces in 5 days, and ships in 4 days. Total order lead time is 11 days. If customs adds 3 days for imported goods, the cumulative lead time is 14 days. That 14-day number is what your inventory planner needs, not the 5-day production figure a sales rep quotes.
Consistent measurement requires four confirmed data points: when the PO is issued, when the supplier acknowledges, when the supplier ships, and when goods are received. Without all four, you cannot separate supplier delays from transport delays, which means you cannot fix the right problem.
Why lead time matters for inventory costs and customer satisfaction

Lead time is the single biggest driver of how much inventory you must hold. Every extra day of lead time means one more day of demand you must cover from stock rather than from incoming supply.
The operational link is direct: lead time sets the reorder point and defines how far in advance buyers must place orders. Cut lead time by 30% and your reorder point drops proportionally. That is not a theoretical benefit; it is cash released from inventory.
The financial effects compound quickly. Carrying costs for inventory typically include capital cost, storage, insurance, and obsolescence risk. For medical consumables with expiration dates, obsolescence is not a rounding error. Safety stock held to cover a long or variable lead time ties up working capital that could fund other procurement priorities. Add the cost of expediting when a stockout does occur, including premium freight and the administrative time of emergency POs, and the true cost of poor lead-time management is substantially higher than most procurement budgets show explicitly.
The profitability case: Research on build-to-order manufacturing found that shorter lead times often improve firm profitability even when faster deliveries require paying expediting premiums. The reason: carrying costs and lost-sale costs from stockouts typically exceed the cost of rush freight. That finding holds in distribution and healthcare procurement as well.
Customer satisfaction follows the same logic. Longer or more variable lead times reduce fill rates. When a clinic runs out of exam gloves or a surgical team cannot find the right isolation gown, the cost is not just a back-order; it is a disrupted procedure, a frustrated clinician, and a procurement team fielding complaints. Inaccurate lead times lead to excess inventory or missed deliveries, and both outcomes damage the supplier relationship and the internal credibility of the procurement function.
How lead time drives reorder point and safety stock, with worked examples
This is where the math pays off. Two formulas govern most inventory planning decisions, and both are directly sensitive to lead time.
Reorder Point (ROP):
ROP = (Average Daily Demand × Lead Time in Days) + Safety Stock
Safety Stock (SS):
SS = Z × σ_demand × √(Lead Time)
Where Z is the service-level factor (1.65 for 95% service level), σ_demand is the standard deviation of daily demand, and Lead Time is in days.
Worked example: exam gloves
Input | Current | After lead-time reduction |
Average daily demand | 57 units | 57 units |
Lead time (days) | 15 | 12 |
Demand std. deviation (daily) | 10 units | 10 units |
Service level (Z) | 1.65 | 1.65 |
Safety stock | 64 units | 57 units |
Reorder point | 814 units | 657 units |
Unit cost | $0.18 | $0.18 |

Safety stock calculation (current): 1.65 × 10 × √15 = 1.65 × 10 × 3.87 = 64 units Safety stock calculation (reduced): 1.65 × 10 × √12 = 1.65 × 10 × 3.46 = 57 units
The reorder point drops from 814 to 657 units, a reduction of 157 units. At $0.18 per glove, that frees roughly $28 in working capital on this one SKU. Scale that across hundreds of high-volume SKUs and the cash release becomes significant.
Shorter lead times also allow you to forecast over a shorter horizon, which improves forecast accuracy and enables leaner safety-stock policies across the board.
When to use simpler approximations: For SKUs with stable, continuous demand, the formula above works well. For intermittent demand (items ordered sporadically), use a demand-during-lead-time distribution rather than a normal approximation. For very low-volume items, a simple days-of-supply buffer tied to lead time is often more practical than a statistical formula.
Pro Tip: Reducing lead-time variability often yields larger safety-stock reductions than cutting average lead time alone. A supplier who delivers consistently in 12 days beats one who averages 10 days but ranges from 5 to 18. Run the formula both ways and show your team the difference.
What actually causes long or variable lead times
Most lead-time problems are not supplier problems. In many supply chains, value-adding processing time is under 5% of total lead time; the rest is waiting, transport, and administrative delay. That means the leverage is almost always in your own processes before you ever call a supplier.
Common internal causes:
Late requisitions from clinical or operational teams, compressing the buyer’s planning window
Slow internal approvals, especially for non-catalog or high-value items
Incorrect lead-time master data in the ERP, causing the system to trigger POs too late
Large batch sizes that delay order release until a minimum quantity is reached
Missing or delayed PO acknowledgements, leaving buyers uncertain whether the order is in the supplier’s queue
Common external causes:
Supplier capacity constraints or production backlogs, especially for high-demand consumables
Transport delays, including port congestion and carrier capacity shortages
Customs clearance delays for imported medical goods, which can add days unpredictably
Documentation gaps, such as missing certificates of conformity or import permits for regulated medical devices
Supplier order-processing delays when acknowledgement discipline is weak
Diagnostic checklist for a problem SKU:
Pull recent POs for the SKU and calculate actual PO-to-receipt days for each.
Compare actual lead times to the ERP master data value. Note the gap and the variance.
Check whether supplier acknowledgements were received and how quickly.
Compare the PO requested delivery date to the supplier-confirmed date. A pattern of COLT exceeding ROLT is a contract issue, not a one-off.
Identify where delays occurred: internal approval, supplier processing, production, or transport.
Pro Tip: Never trust the supplier’s quoted lead time as your planning baseline. Measure actual PO-to-receipt across your last 10–15 orders for that SKU. Quoted lead times are often optimistic, and the variance you find in real data is usually the bigger planning problem.
Practical levers to shorten lead time or control variability
Not every lever is worth pulling on every SKU. The right intervention depends on the root cause, the SKU’s criticality, and the ROI of the fix.
1. Measure real lead time first
Before any other action, establish an accurate baseline. Pull historical PO-to-receipt data, calculate average lead time and standard deviation, and update your ERP master data. Planning against wrong numbers makes every downstream calculation wrong.
2. Improve order accuracy and completeness
Incomplete POs, wrong item numbers, or missing specifications are a leading cause of supplier delays. A clean, complete PO that matches the supplier’s catalog reduces processing time on their end and eliminates back-and-forth that adds days.
3. Use forecasts and call-offs
For high-volume, predictable SKUs, a blanket purchase order with scheduled call-offs lets the supplier plan production in advance. You get shorter effective lead times because the supplier is not starting from zero when you release each order.
4. Streamline internal approvals
Map your internal approval workflow and identify where POs sit waiting. For pre-approved suppliers and catalog items under a set dollar threshold, automated approval can cut days off the internal processing time before the PO even reaches the supplier.
5. Reduce batch sizes
Large batches delay order release and increase the time goods spend waiting between process steps. Smaller, more frequent orders often reduce total lead time even when per-unit freight costs rise slightly. Reducing WIP and establishing flow compresses lead time in both manufacturing and distribution contexts.
6. Introduce SLAs and acknowledgement requirements
Require suppliers to acknowledge POs within 24–48 hours and confirm a delivery date. Include this in your supplier contracts and score it on your supplier scorecard. An unacknowledged PO is a lead-time risk you cannot see.
Vendor questions to include in RFQs and supplier reviews:
What is your standard lead time for this item, and what is the range across your last 12 months of orders?
What is your current production backlog for this category?
What is your PO acknowledgement turnaround time?
What documentation is required for shipment of regulated medical items, and who is responsible for it?
What are your capacity constraints during peak demand periods?
7. Multi-source strategically
For critical SKUs where a single supplier’s lead time or reliability is a risk, a second approved supplier provides a fallback. The procurement case for multi-sourcing is strongest when the cost of a stockout (clinical disruption, emergency purchase premium) exceeds the administrative cost of managing two supplier relationships.
8. Hold strategic safety stock where multi-sourcing is not feasible
For sole-source items or highly regulated medical devices where qualifying a second supplier takes months, a higher safety-stock target is the practical hedge. Calculate the carrying cost explicitly and compare it to the cost of a stockout. For clinical-critical items, the math almost always favors more stock.
Pro Tip: When negotiating with suppliers, ask for confirmed lead-time commitments in writing, not just quoted lead times. Include a consequence clause for late delivery, such as a freight credit or priority scheduling on the next order, and an incentive for consistent on-time performance. Suppliers who agree to measurement are the ones who take it seriously.
How to track lead time and hold suppliers accountable
Measurement is where most procurement teams leave money on the table. They track average lead time but ignore variance, which is the number that actually drives safety-stock requirements.
The KPIs that matter:
Average lead time (PO-to-receipt): The mean elapsed days across all orders for a SKU or supplier in a period. Useful for setting ERP master data and reorder points.
Lead-time standard deviation: Measures variability. A high standard deviation means your safety-stock formula must cover a wide worst-case window. This number often matters more than the average.
% of orders meeting confirmed lead time: The share of POs where actual receipt date matched the supplier-confirmed date. This is your supplier’s delivery reliability score.
OTIF (on-time, in-full): Combines delivery timing with order completeness. A supplier who delivers on time but ships 80% of the quantity is still a planning problem.
Expediting cost as a % of spend: Tracks the financial cost of lead-time failures. Rising expediting spend is an early warning that lead-time management is breaking down somewhere.
Sample supplier scorecard metrics:
KPI | Measurement method | Target threshold |
Average lead time | Mean PO-to-receipt days, last 90 days | Within ±2 days of ERP master data |
Lead-time std. deviation | Std. dev. of PO-to-receipt, last 90 days | < 3 days for critical SKUs |
On-time delivery rate | % of POs received on confirmed date | ≥ 95% |
OTIF rate | % of POs on-time and in-full | — |
PO acknowledgement rate | % acknowledged within 48 hours | — |
Expediting cost | Emergency freight + admin cost / total spend | < 2% of spend |
For meaningful measurement, review multiple POs per SKU before drawing conclusions to ensure accurate averages. Fewer orders than that and a single outlier distorts the average and standard deviation. For high-volume SKUs, a rolling 90-day window gives a current picture without being swamped by historical data that no longer reflects the supplier relationship.
Accurate lead-time forecasting requires software that can store historical PO data at the line level. If your ERP does not surface PO-to-receipt history easily, a simple spreadsheet tracking PO date, confirmed date, and receipt date for each order is a workable starting point.
Lead time in medical supplies procurement: a practical example
Medical supplies procurement carries lead-time consequences that most other categories do not. A stockout of exam gloves or isolation gowns is not a backorder situation; it is a clinical disruption with patient-safety implications. That asymmetry changes the math.
Example SKU: CPE isolation gowns (high-turn consumable)
A mid-size ambulatory surgery center orders isolation gowns weekly. Current supplier lead time averages 14 days with a standard deviation of 5 days. At a service level of 95% (Z = 1.65) and average daily demand of 30 units with a daily demand standard deviation of 8 units:
Safety stock = 1.65 × 8 × √14 = 1.65 × 8 × 3.74 = 49 units Reorder point = (30 × 14) + 49 = 420 + 49 = 469 units
After working with a supplier who reduces average lead time to 10 days and standard deviation to 2 days:
Safety stock = 1.65 × 8 × √10 = 1.65 × 8 × 3.16 = 42 units Reorder point = (30 × 10) + 42 = 300 + 42 = 342 units
The reorder point drops by 127 units. For a gown priced at roughly $1.50, that is about $190 in working capital freed on a single SKU. Across a full catalog of high-demand medical consumables, the aggregate release is meaningful.
Sector-specific complications add lead-time risk that general procurement guides do not address. Imported medical devices and PPE may require FDA registration documentation, certificates of conformity, or country-of-origin declarations. Missing paperwork at customs can add 3–7 days unpredictably. Expiration dates create an obsolescence risk that penalizes over-ordering; holding 90 days of safety stock on a product with a 12-month shelf life is a different risk profile than holding the same quantity of a non-perishable item. For clinical-critical items, the cost of a stockout includes procedure delays, staff overtime, and potential patient harm, none of which appear in a standard procurement cost model but all of which procurement leadership is accountable for.
Checklist for healthcare buyers prioritizing SKUs for lead-time improvement:
Clinical criticality: Would a stockout delay a procedure or compromise patient safety?
Demand variability: Is daily or weekly demand stable or highly variable?
Current lead-time variance: Is the supplier’s delivery window consistent or wide?
Cost per unit and safety-stock dollar value: Is the working capital tied up in safety stock significant?
Sole-source risk: Is there a qualified backup supplier, or is this a single-source item?
For medical supply chain management, prioritize the intersection of high clinical criticality and high lead-time variance. Those SKUs carry the most risk and yield the most benefit from targeted lead-time work.
Hospital and clinic operations that rely on fast, predictable restocking also benefit from understanding why fast restocking matters in clinical settings, particularly for point-of-care supply points where delays have immediate operational consequences.
Key Takeaways
Lead time is the most direct lever procurement teams have over inventory levels, working capital, and customer fill rates, and reducing variability matters as much as cutting the average.
Point | Details |
Lead time sets reorder point | Every extra day of lead time raises the reorder point and the inventory you must hold before triggering a new order. |
Variability drives safety stock | A supplier with inconsistent delivery windows forces higher safety stock than one with a longer but predictable lead time. |
Measure actual PO-to-receipt | Pull the last 10–15 POs per SKU and compare actual lead times to ERP master data before recalculating safety stock. |
Supplier SLAs reduce firefighting | Requiring PO acknowledgement within 48 hours and scoring OTIF on a supplier scorecard makes lead-time problems visible before they become stockouts. |
Queenssurgical for medical consumables | Queenssurgical supplies high-demand medical consumables across the Americas with predictable fulfillment, supporting shorter effective lead times for procurement teams. |
Lead time is the KPI most procurement teams undervalue
The conventional wisdom in procurement is to focus on unit price. Squeeze the supplier on cost, run competitive bids, and report savings to leadership. That is a defensible strategy until you add up what you spend on expediting, emergency freight, and the carrying cost of safety stock you hold because you cannot trust your supplier’s delivery window.
Lead time is where the real leverage is, and most procurement teams treat it as a background variable rather than a managed output. The buyers who change that mindset spend less time firefighting. They place orders earlier, hold less stock, and have supplier conversations that are about performance data rather than excuses.
The medical supplies context makes this sharper. A stockout of a surgical consumable is not an inconvenience; it is a clinical event. The procurement team that has accurate lead-time data, realistic safety-stock calculations, and supplier SLAs in place does not get that call. The one that is still running on quoted lead times and gut-feel reorder points does.
If you want to start somewhere, the 10–15 PO review described in this article takes about an hour per SKU. Do it for your top 10 items by spend or clinical criticality. What you find in that data will tell you more about your supply risk than any supplier presentation ever will.
Queenssurgical: reliable medical supply fulfillment for procurement teams
Procurement teams managing medical consumables need a supplier whose lead times are predictable enough to plan against. Queenssurgical supplies high-demand PPE, disposables, and medical consumables across the Americas, with consistent stock availability on the items that drive the most reorder activity.

For buyers working to shorten effective lead times and reduce safety-stock requirements, sourcing from a supplier with reliable fulfillment is one of the fastest levers available. Queenssurgical carries products like CPE isolation gowns, DynaShield Skin Protectant Cream, and a broad catalog of consumables that procurement teams reorder regularly. Volume purchasing and wholesale pricing are available for clinics, hospitals, and healthcare facilities that want to consolidate suppliers and reduce the administrative cost of managing multiple vendor relationships.
Visit Queenssurgical to browse the catalog, request volume pricing, or set up a procurement account.
Useful sources and further reading
These references cover the formulas, frameworks, and industry evidence behind the guidance in this article.
Lead time analysis guide — Supply Chain Math: Detailed walkthrough of safety-stock and reorder-point calculations with lead-time sensitivity analysis. The most directly applicable reference for the formulas in this article.
The impact of customer order lead time-based decisions on firm profitability — University of Vaasa: Academic research linking lead-time decisions to profitability in build-to-order manufacturing. Useful for the business case behind lead-time investment.
Lead Time — TPS Encyclopedia, Art of Lean: Toyota Production System perspective on where lead-time waste occurs and why flow improvement outperforms speed improvements on individual steps.
Lead-time in procurement — Learn How to Source: Buyer-focused checklist covering PO management, acknowledgement discipline, and sourcing tactics that affect lead time in practice.
Lead Time: What It Is and Why It Matters — Mailchimp: Clear explanation of confirmed vs. requested lead time and the service-gap implications when COLT exceeds ROLT.
Lead Time Defined — NetSuite: Practical overview of lead-time types and the role of software in accurate forecasting and inventory coordination.
Why Focusing on Lead Time, Not Just Efficiency and Cost — University of Wisconsin: Manufacturing-focused argument for lead time as a primary competitive and profitability driver, with practical implications for procurement strategy.
For procurement teams looking for a supplier with consistent fulfillment on medical consumables, visit Queenssurgical for catalog access and volume purchasing options.
Recommended
Comments